In the previous article of our series, we talked about the advantages of leveraging multiple models for more accurate prediction. In this article we will explain and give examples of aggregating predictions from various models. As mentioned before, aggregating predictions is an easier alternative to the “meta-model” approach and it could be done by any trader to “summarise” the predictions of multiple models into just one prediction, which will make it easier for you to benefit from the predictions of multiple good models. Suppose that today’s Ethereum price is 2220$ and the following are the results of the best five models:
One day prediction (Ethereum) | Average Model error | Upper limit of the Error range | Lower limit of the Error range | |
Model 1 | 2450 | ±1.2% | 2479 | 2421 |
Model 2 | 2310 | ±1.7% | 2349 | 2271 |
Model 3 | 2200 | ±2% | 2244 | 2156 |
Model 4 | 2190 | ±1.3% | 2218 | 2162 |
Model 5 | 2290 | ±2.3% | 2343 | 2237 |
There are multiple methods you could try, we will mention few examples,
Method 1: Average the price prediction and use the widest error range. You select the best 5 models from the ones you create. The criteria for a model to be “good” is based on your preference. For example, you could choose models with lowest average error or the highest direction accuracy. You basically use the minimum and maximum limits of error range from all the 5 models as your aggregated minimum and maximum limits of the error range.
Method 2: Average the best 5 models. This is the simplest method. Then you simply average the predictions of these models. Similarly, you also calculate an aggregate model error by averaging the 5 model error rates. Next, you can calculate a new error range from the aggregate model error.
Method 3: excluding extreme predictions then Average. In this case, the one day prediction of Model 1 is +10% which is very unlikely to happen. So, excluding this prediction then Averaging the predictions from the 4 other models might improve your overall accuracy
Here is how your final predictions would look like:
Final one day prediction | Upper limit of the Error range | Lower limit of the Error range | |
Method 1 | 2288 | 2479 | 2156 |
Method 2 | 2288 | 2327 | 2249 |
Method 3 | 2248 | 2288 | 2207 |
These three methods are just examples, you could for instance use the median instead of the average or do a combination of different methods or aggregate predictions from more than five models.
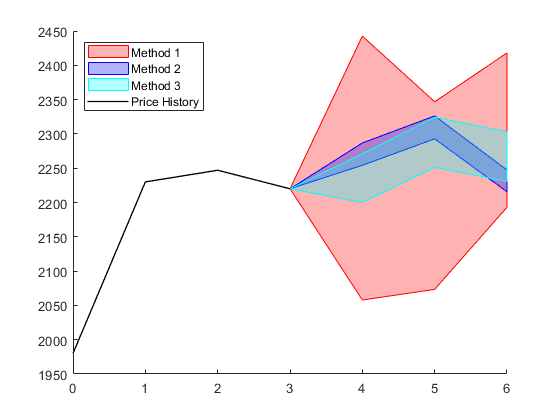
Let’s take another example, this time with a 3 day prediction for 5 different models. Figure 1 illustrates the results of the 3 different aggregation methods. In Method 1, we get the maximum error range. In Method 3, we exclude the extreme results of model 1 then average the error rate of the other 4 models and calculate a new error range based on the new error rate. Method 2 is similar to method 3 but without excluding any results.
In conclusion, the art of aggregating predictions from multiple models will significantly enhance the accuracy of your predictions. However, it’s important to remember that these methods are not just about numbers; they are about understanding market dynamics in a more holistic way. Whether you choose to use the average, median, or a combination of different methods, the goal remains the same: to enhance decision-making in an ever-evolving market. As we continue to explore and refine these techniques, we invite traders to experiment and discover the approach that best aligns with their trading style and market philosophy.